

The relationship investors take for granted
OK, let’s face it, most analysts would suggest that equities lead commodity prices. That makes sense; investors value mining companies on future earnings, so their shares should reflect expectations about where commodity prices are heading, rather than simply respond to today’s spot price.
But the fact is – there is a relationship between spot commodity prices and equities. And, over time, you can track that relationship for most segments.
In this analysis, I’ve put together a basket of equities in certain segments of the industry (large and small silver producers, large and emerging copper producers, hard rock and integrated lithium producers) and examined the relationship between the price of those baskets and the underlying material price on a daily basis over several years.
The results suggest that, while the relationship between commodity prices and mining equities remains remarkably consistent in some markets, in others it’s changed substantially, and in some it’s a lot less predictable than investors might expect.
Copper: the relationship that works
I’ve developed two copper baskets, one with large copper producers and one with smaller producers that have emerged over the past 5-10 years.
Let’s start with the large cap basket. It’s had the tightest relationship over time. Over the past six years, the large-cap copper basket has maintained a remarkably consistent relationship with the LME copper price. The relationship has become slightly less tight since January 2025, but the line of best fit is still broadly similar to what we’ve seen before.
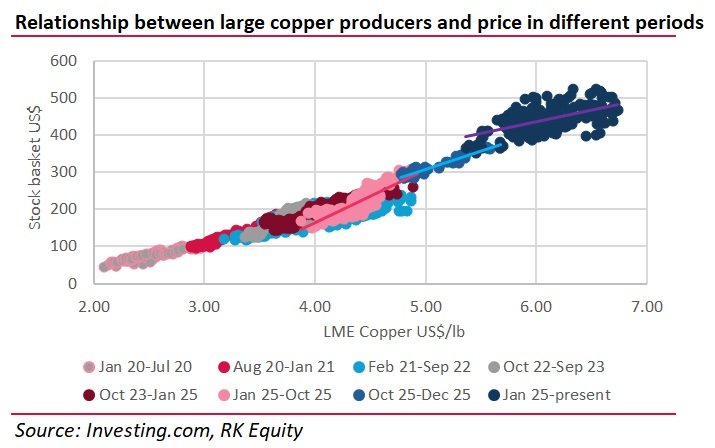
Amongst the mid-cap producers, we can see that the basket price moves more for each move in copper price than for the large caps. Note the scale: the midcap basket price has increased by twice as much since January 2020 as the large cap basket price. And this is what we would expect to see as well, because growing producers tend to have more operating leverage to the commodity price.
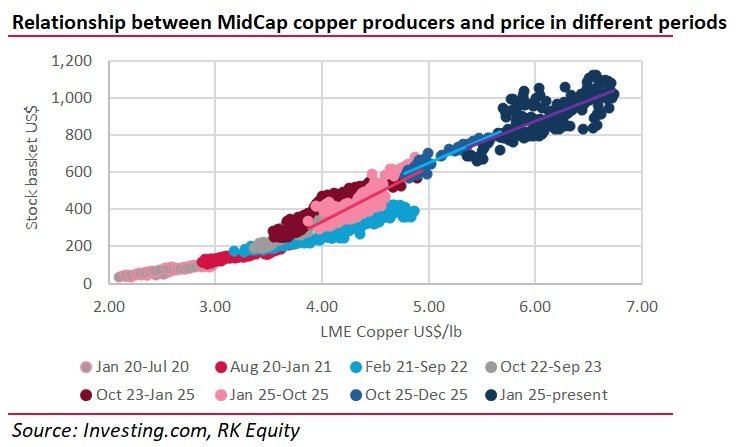
In the past I’ve used the rolling relationship between the basket and the copper price to calculate what copper price equities are currently pricing in. The maturity of the copper industry and its transparency helps this to be one of the more stable relationships in global commodities.
Silver: The relationship that has changed
The charts for copper above show that the relationship between copper equities and the commodity has remained roughly constant over the past six years.
But that’s not the case for silver.
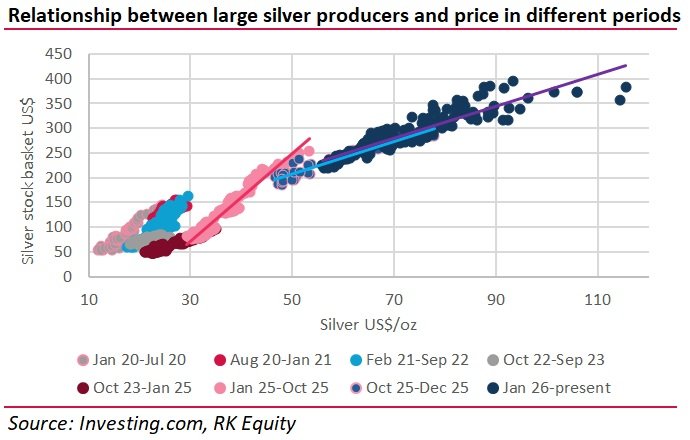
Amongst silver large caps, the relationship between stocks and the silver price has substantially changed over time. Look at the chart above – particularly at the different gradients of the lines of best fit in different periods.
What we’re seeing here is that between Jan-Jul 2020; Feb 2021-Sep 2022; and Jan-Oct 2025, silver stocks moved up more for each increase in the silver price than they have done in other periods.
And indeed, after much excitement around silver stocks in Jan-Oct 2025, there has been considerably less excitement in the equity market since then.
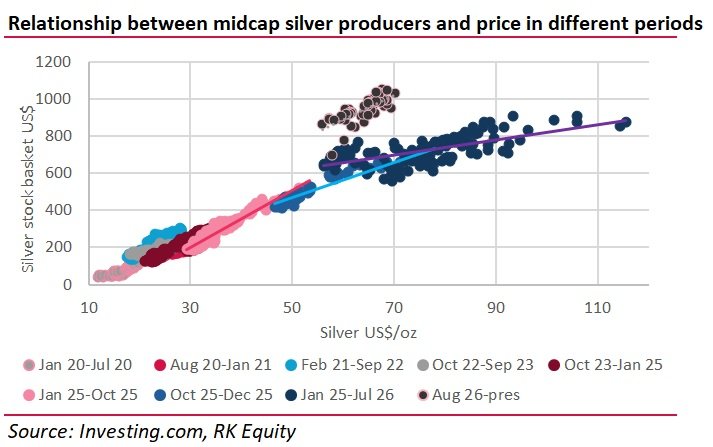
The situation in the midcap segment is further differentiated, with two constituents of our basket experiencing a fundamental re-rating. That can happen with smaller stocks, which can grow by drilling or M&A. It highlights why there’s often more upside in MidCap producers than in large caps.
Why does the relationship change over time?
Well, it could be a number of factors:
- Changing expectations about future silver prices. Investors may be willing to pay more for producers when they expect prices to rise substantially or high prices to persist than when they believe the commodity is approaching a cyclical peak.
- Changing investor appetite for precious metals equities. As we all know, silver is both an industrial and a precious metal. Equities can therefore be influenced by changing expectations about monetary policy, inflation, real interest rates, which can impact the valuation that investors are prepared to place on silver producers.
- Changing investor appetite for mining equities. When the mining sector is out of vogue, investors may be unprepared to pay premium valuations for any stocks.
But it is interesting to me that the relationship between silver equities and silver prices seems to be considerably more cyclical than that for copper equities and copper prices.
Lithium: A less predictable relationship
Compared to copper and silver, lithium is a much less mature market. And the stock/commodity price relationship clearly illustrates that.
The Australian hard rock production industry has only really emerged over the past ten years and, while stocks like Albemarle and SQM have existed for longer, lithium wasn’t their primary driver until more recently.
And there’s another factor in the lithium industry as well, which I think is important. Lack of investor understanding of the industry. It’s particularly difficult for investors to call the lithium industry because it’s been difficult for analysts to call the industry. As I’ve highlighted in other recent articles, most analysts have repeatedly underestimated demand in the lithium industry by 20-25%. While they’ve also underestimated supply, they’ve underestimated demand by more, giving a forecast of the industry which simply hasn’t happened.
That forecasting issue has created considerable uncertainty in the lithium industry for investors.
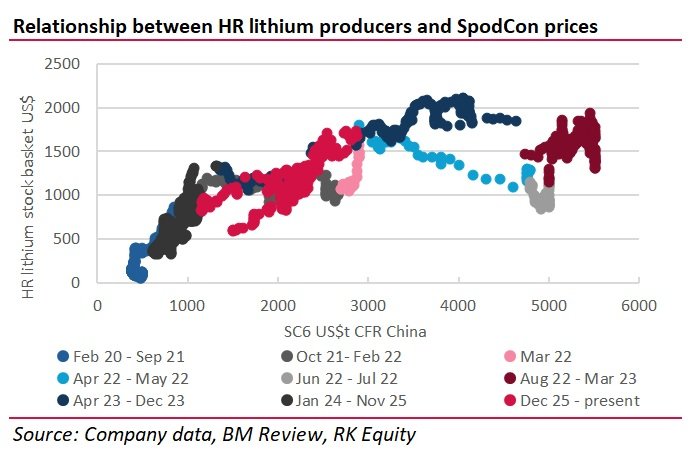
When you look at the charts below, I think you can see that the relationships between stocks and commodities is considerably less tight than for the other commodities I’ve discussed and, indeed, stock prices tend to move out of lockstep with commodities in ways we don’t really see in the other markets.
We see a similar thing, although not to the same extent with the larger cap, exclusively US-listed, integrated lithium producers.
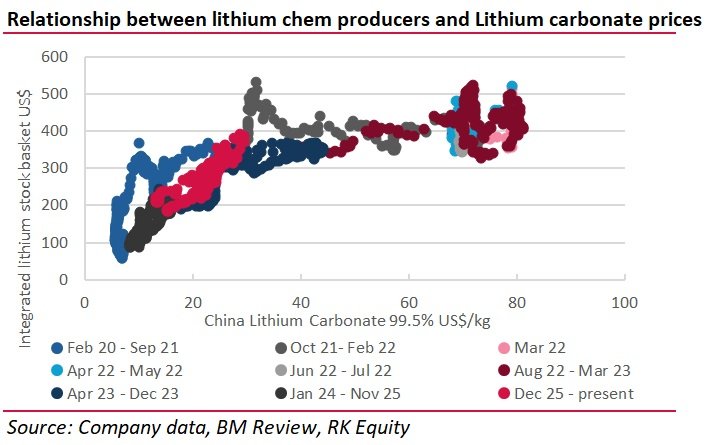
In lithium, as with silver, we see periods when the market seems willing to bid up lithium stocks more for a corresponding increase in price. Periods like 2020 for instance.
And then we see periods when it doesn’t really seem to matter how much prices increase because the market doesn’t seem at all interested in lithium, periods like the second half of 2023, for instance.
So has the relationship broken down?
Well, my answer is – not universally. But you have to ask yourselves – what sort of relationship existed in the first place?
It’s very clear from the charts above that relationships for different materials change over time. Relationships between equities and commodities are cyclical and therefore we have to understand that equity investors are reactive to the medium to longer term outlook for a particular commodity.
To some extent that’s what we have seen in copper; the prevailing narrative in the industry since 2015 has been this view of a large long-term deficit. Coupled with the maturity and transparency of the market, that has allowed the relationship between the commodity and equities to remain tight.
Whereas in silver, cracks have appeared in the long-term deficit/price argument over the course of this year; this has likely resulted in investors not bidding up silver stocks as much with increases in price.
In lithium the forecasting gap, and the resulting wide range of short to medium term expectations in the market, has meant that the relationship is weaker. Can that improve as the market matures? I believe it can.
For investors, the important point is that historical relationships between commodity prices and mining equities can be useful, but they’re not set in stone. In established markets like copper, they can provide a valuable indication of what commodity price equities are anticipating. But in markets where expectations change rapidly, like silver and lithium, relying on those historical relationships can be misleading. Being right about where a commodity price is heading doesn’t necessarily mean you’ll be right about the mining stocks.