
It’s a big bugbear for me that renewables analysts are so conservative on their forecasts for solar installations. I mean how can you allow yourself to make the same mistake for nearly five years in a row?
For full disclosure here, I should say that I’ve been an analyst for 25 years now. I’ve had my share of good calls and absolute howlers, but I guess I’m right more than 50% of the time. That doesn’t sound like a lot, but – trust me – it’s good in this business!
I make mistakes. Of course I do! But I try not to make the same mistake twice. And I certainly don’t make it three times.
So I don’t understand how most renewables analysts can get it so wrong for years in a row on solar installation forecasts?
And hey, if this was an isolated industry, I wouldn’t really care. But the fact is that solar installation forecasts have a huge knock on effect on other industries. On BESS (and hence lithium demand), on aluminium, copper, steel, polysilicon, silver and antimony, to name but a few.
By under-forecasting solar installations, analysts are setting other industries up to fail. Big time.
So in this series of articles I’ll discuss a few scenarios for solar installations over the next 5-10 years and then I’ll go on to analyse the demand impact on upstream materials.
Solar installation forecasts – wrong, wrong wrong!
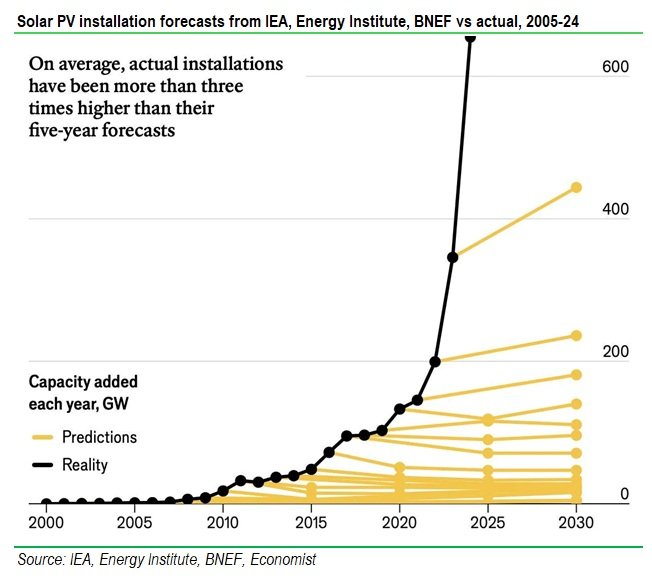
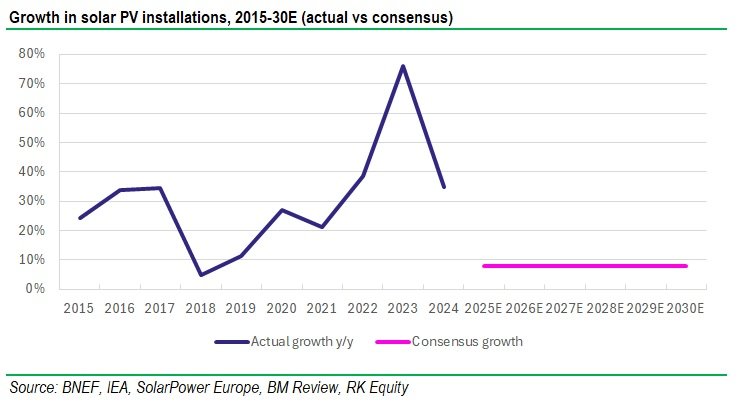
A recent Economist article highlights how shocking analysts’ solar installation forecasts have been over the past 5-10 years and it really doesn’t seem to be getting much better, despite repeatedly higher than expected growth in recent years.
Despite an average growth rate of 36-40% in global solar installations over the past five years (depending on whose dataset one uses), BNEF (in its global PV outlook from Q1/25) is forecasting an average growth rate of 5% pa for 2026-30 and IEA (in its Renewables 2024 report) is forecasting an average growth rate of 6% per annum over the same period. It really does boggle the mind that analysts could continue to get it so wrong!
What’s changed in solar?
This is particularly bad given the step-change in solar economics that we’ve seen in recent years which, when coupled with the advent of BESS, means that solar as an electricity source has become much more viable for both baseload and variable power than it once was.
Let’s talk about that change in economics.
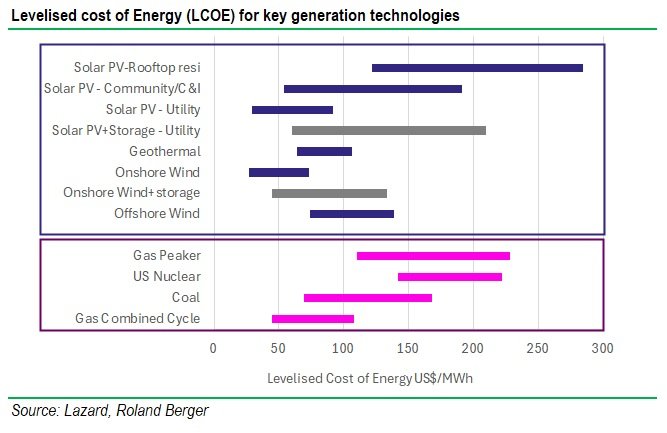
If we look at the Lazard Levelised Cost of Energy (LCOE) analysis, we can see that the LCOE for Utility-scale Solar PV and Utility-scale Solar+Storage are now competitive with most hydrocarbon-based energy sources. In fact Utility-scale solar (at the bottom of its range) is cheaper than coal, gas peaker and CCGT power sources.
That’s quite a massive change and, if we look at the chart below, we can see how substantial the change has been in LCOE and costs for solar and batteries over the past 10 years.
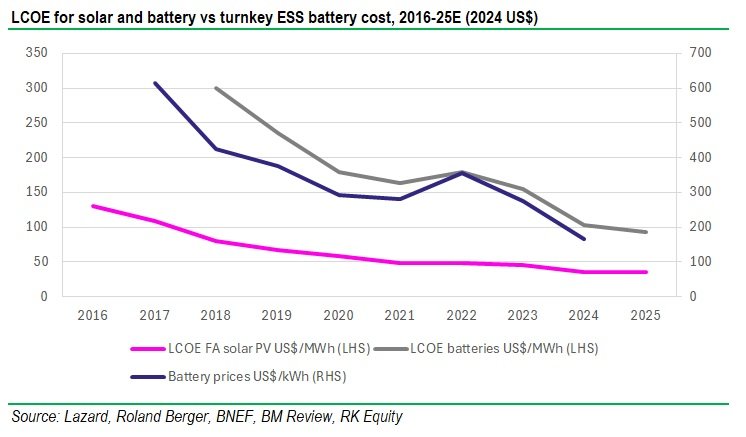
The change in the economics of solar+storage is profound. Not only are we seeing cheaper solar panels and cheaper batteries, but we are also seeing the technology of batteries improving to such a degree that bigger battery systems are being found in smaller containers with higher efficiencies and longer cycle lives. This means that doubling up of lithium-ion batteries in ESS is possible, which results in longer durations with less degradation.
And it stands to reason that that alters the economics of solar. Because in the past my 1GW solar power station could only operate during the hours of daylight and on sunny days, which meant that its average capacity factor was 20-30% vs a natural gas CCGT plant at 60-85%.
But, while adding a two-hour duration ESS plant only increases the average capacity factor for a solar plant slightly to 25-35%, adding one with four-hour storage increases it to 30-45%, with six-hour to 35-50% and one with eight-hour (long duration) storage to 40-55%, that’s coming up to the level of semi-firm or firm generation. So, as lithium-ion BESS durations are increasing, solar itself is becoming a more efficient and hence more economic power generation solution.
For me, this step-change in the technology and cost of batteries and the economics of solar and solar+storage is not being fully appreciated by the market and, based on the forecasts cited above, the potential for solar continues to be underestimated.
Some new scenarios
So, given what I’ve discussed above, you probably won’t be surprised to know that there is quite a substantial range of forecasts for global solar installations in 2030 .
- IEA’s 2024 base case forecast is for 701GW of solar installations per year in 2030;
- BNEF’s Q1/25 Solar PV outlook calls for 847GW of installations in 2030;
- SolarPower Europe forecasts 1000GW of installations in 2030;
That’s an average growth rate (for the three forecasts) of 8.1% per annum from 2026-30E.
But, as I noted above, the average rate of growth over the past five years has been 36-40% per annum . So how viable is it that, given the changes in solar economics and the falling cost of panels, the grow rate will fall to this extent?
Not viable at all, in my view.
So to get around this issue, I’ve proposed some growth scenarios of my own. Note also that I’m going to be forecasting over the next ten years not only the next five. My scenarios are defined as:
- Ultra-Conservative Scenario (UCS): 8.1% per annum – that’s what all the “experts” suggest, but I think they’re way out of the money.
- Base-Case Scenario (BCS): Let’s say 15% per annum between 2025-35E. That’s double the consensus growth rate but half the 10-year growth rate.
- Optimistic Scenario (OS): Let’s make this 20% per annum between 2025-35E. That’s pretty racey for a 10-year period, but it’s not outside the realms of possibility given the magnitude of what needs to be done.
- Uber-Optimistic Scenario (UOS): I’m going for 30% per annum for the 2025-35E period. That’s still below the average growth rate for the past 5 years, but in line with what we’ve seen over the past 10 years.
For those who are graphically-inclined and feel that a picture tells a thousand words, here you go:
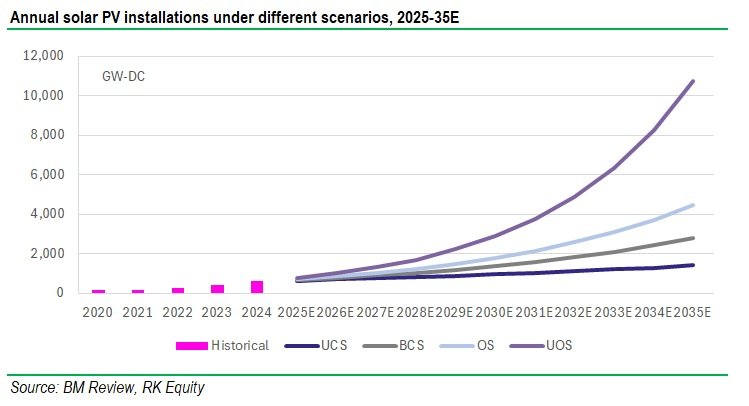
As you can see, there’s quite a substantial variance in terms of the annual installation levels by 2030 and 2035 depending on the different scenarios.
I’ll leave you, the reader, to ponder that and in the next few editions of the Blog I’m going to model and analyse the impact on demand from the different scenarios for key materials such as Copper and Aluminium, Silver and Antimony, and Lithium.
Til the next time!