
In Part 1 of this Series I explained why I think current solar installation forecasts from big groups like IEA and BNEF are overly conservative. I flagged how these forecasts being overly conservative doesn’t just impact the solar industry, but other industries as well. Metals industries are highly-leveraged to the solar industry and in part 2 I discussed the impact of solar installation forecast scenarios on Copper and Aluminium demand. In Part 3 of this series it’s time to look at Silver and Antimony.
In Part 1 I described four scenarios for solar installations over the next 10 years. They were:
- Ultra-Conservative Scenario (UCS): 8% per annum – that’s what the “experts” have as their consensus, but I think they’re way out of the money.
- Base-Case Scenario (BCS): Let’s say 15% per annum between 2025-35E. That’s double the consensus growth rate but half the 10-year growth rate.
- Optimistic Scenario (OS): Let’s make this 20% per annum between 2025-35E. That’s pretty racey for a 10-year period, but it’s not outside the realms of possibility given the magnitude of what needs to be done.
- Uber-Optimistic Scenario (UOS): I’m going for 30% per annum for the 2025-35E period. That’s still below the average growth rate for the past 5 years, but in line with what we’ve seen over the past 10 years.
Now it’s time to apply those forecasts for solar installations to two materials that are much smaller markets than copper and aluminium and thus are likely to be more leveraged to super-normal growth in solar installations.
Silver usage in solar
Silver is the best conductor of electricity amongst all the metals and in photovoltaic (PV) solar cells, silver paste is screen-printed onto the silicon wafer to create fine conductive grid lines which collect the electrons generated when the sunlight strikes the silicon. They then allow current to flow efficiently.
Most of the silver is used on the front of the panel, but a small amount is used on the back as well.
Over time, manufacturers have been experimenting with reduced silver usage through thinner lines and improved printing methods, and silver loadings per MW in solar have fallen substantially. In the early-2000s they were c.80kg/MW, by 2016-17 this had fallen to 26kg/MW. However, with the introduction of new, high-efficiency cell designs like PERC, TOPCon and heterojunction, silver loadings have risen again and may be as high as 65kg/MW in some designs. On average, however, I’ve used 8-12kg/MW in my forecasts.
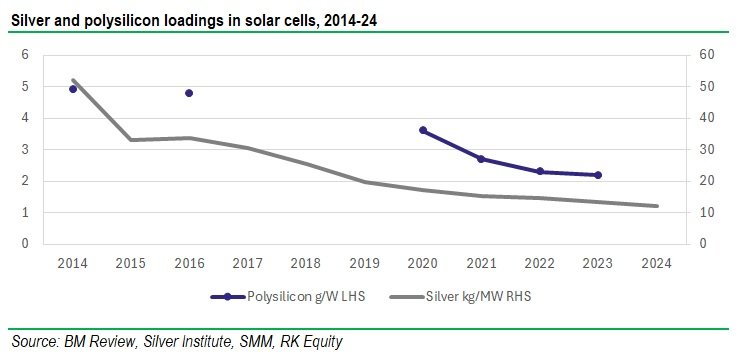
In my calculations I’ve assumed that the bleed rate for silver intensity is 8% (ie silver loadings reduce at 8% per annum) in order to be conservative. But, even with this quite large handicap, the impact on the silver market from the different scenarios is still really substantial.
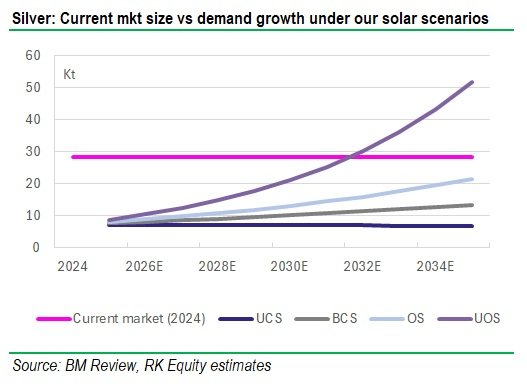
Under my UOS, silver demand is 180% of the current market size and even under the OS, it’s 75%. That’s a very substantial amount of growth that would be necessary in silver production and I would caution that the silver industry is struggling to add supply with silver prices where they are, even though they are up from recent levels.
There is a feeling amongst many investors that silver is just a poor man’s gold and, while silver has run strongly over the past year due to investment demand, to ignore its industrial applications is to do it a disservice. And potentially do investors a disservice as well, in my view.
Antimony usage in solar
This is a difficult one. Primarily because data on the antimony market is extremely sparse. In fact, I have even had to make an estimate on what global antimony demand was in 2024! According to USGS, mined production was of the order of 100Kt, and I estimate recycled antimony production at c.40Kt. If I factor in some destocking, I come around to about 150Kt of antimony demand. Some consultants have it in the order of 200-250Kt, some have it much lower than that. But we’ll stick to 150Kt as a reasonable approximation.
It’s only been in recent years that antimony has become a major material of interest in the solar industry but, since then, it’s become a very interesting material indeed! Antimony’s uses in solar are listed below:
- Antimony selenide is a light-absorbing material that’s used for thin-film cells, primarily as a lead-free alternative to perovskites and cadmium compounds. Antimony sulfide, which is cheaper, may also be used in these applications and is non-toxic and scalable, although not quite as effective.
- Antimony may also be used in small quantities to dope (enhance) other layers in perovskite solar cells, although this use typically only involves small amounts of antimony.
- Antimony trioxide has historically been used in the manufacture of solar glass although its usage is declining due to toxicity concerns. However the use of sodium antimonate as a clarifying/fining agent is becoming increasingly important. It helps to remove bubbles and impurities like iron which cause coloration and reduce light transmission.
- A number of experimental solar technologies use antimony-alloyed interfaces or contact layers to improve charge collection or reduce recombination losses.
For now, perovskites and thin film are still a relatively small contributor to solar markets, although they are growing rapidly. While data on the makeup of the solar industry us scarce, many suggest that perovskites are under 1-3% of the global market currently and lead-free perovskites are only 10% of that.
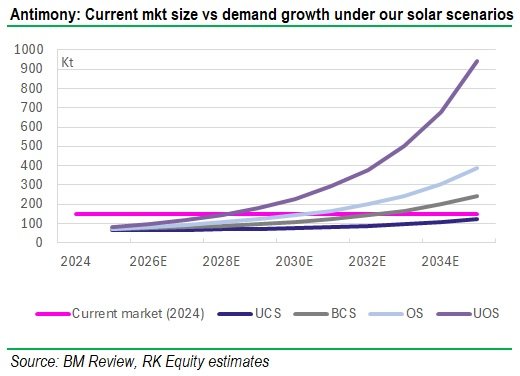
However use of antimony in solar glass is a rapidly-growing market – Antimony demand from the solar industry in China has been estimated at 38.5Kt in 2024 (over 25% of the entire antimony market), that’s up from 18.7Kt in 2022, and some commentators are suggesting that it could reach 68Kt by 2026. The bulk of this is via the use of sodium antimonate as a clarifying agent.
I’ve modelled both of these use points in my analysis. While the use of antinomy in perovskites is enough to get one excited about antimony use, incorporating the use of antimony as a clarifying agent kicks my forecasts sky high. As with all the forecasting I’ve done in this article, I’ve attributed a bleed factor (of 5% pa in this case) for antimony loadings to account for thrifting, and I’ve also modelled a declining market share. Even with these factors, my model implies that the antimony market will need to increase by multiples of its current size under almost all of the scenarios.
Solar under-forecasting could have serious ramifications for both silver and antimony prices
So, unlike for copper and aluminium, where the impact of solar under-forecasting was serious but not insurmountable, in both silver and antimony the under-forecasting of solar installation growth could mean that the commodity is massively undersupplied. In markets like that which we’ve seen before, this normally results in a multi-year price spike.
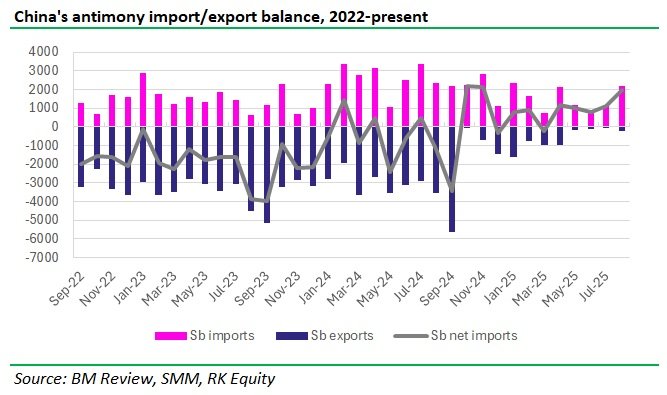
And the price has already spiked in antimony due to the Chinese export controls. One question I’m asked regularly is – if the Chinese remove export controls, what will that do for the antimony price? Well, on the evidence of the chart above, probably not very much, in my view. Even before China imposed export controls on antimony, effective in September 2024, its net exports of antimony had dropped 63% y/y YTD. I’ve looked at China for a long time and seen lots of structural changes in commodities markets and that very much looks like one to me. Even if China were to remove export controls on antimony, I wouldn’t be surprised if exports don’t pick up substantially at all…
Which means that I’m still pretty happy that antimony prices could rise substantially from here. And so could silver. Of course, there will be thrifting and – if supply is unable to catch up – eventually moves away from the use of these materials, but if I’m investing I’m in for the price rise, and I’m pretty confident that that prices are going to rise much further in both of these metals.